The Browse Database provides simple tools for protein search. Firstly, structures can be filtered by the probability to be knotted based on:
Predicting model category: the AlphaFold version 4 (AF4), AlphaFold version 1 (AF1) or ESMFold model version (ESM1). Moreover you can make more precise search of AF1 structures based on our manual assignment (i.e. AF1 Knot, AF1 Unsure, AF1 Artifact, AF1 Unassigned).
Biological category: you can narrow down results to a chosen source organism, family of organisms, gene or enzyme comission number (EC). During entering a text prompt window will appear.

Figure 1. Filter panel.
The features displayed on the default screen change relative to the chosen categories after you press "Filter". Secondly, the database can be further searched based on:
Knot types: structures are grouped based on the occurrence of the given knot type with at least 48% probability.
Knot core length: structures are grouped based on their knot core length (the shortest subchain of the backbone chain that forms the same knot as the entire backbone chain).
Knot tail length: structures are grouped based on their knot tail length (parts of the backbone chain between the knot core and the N or C terminal – referred to as knots N-end length and knots C-end length respectively).
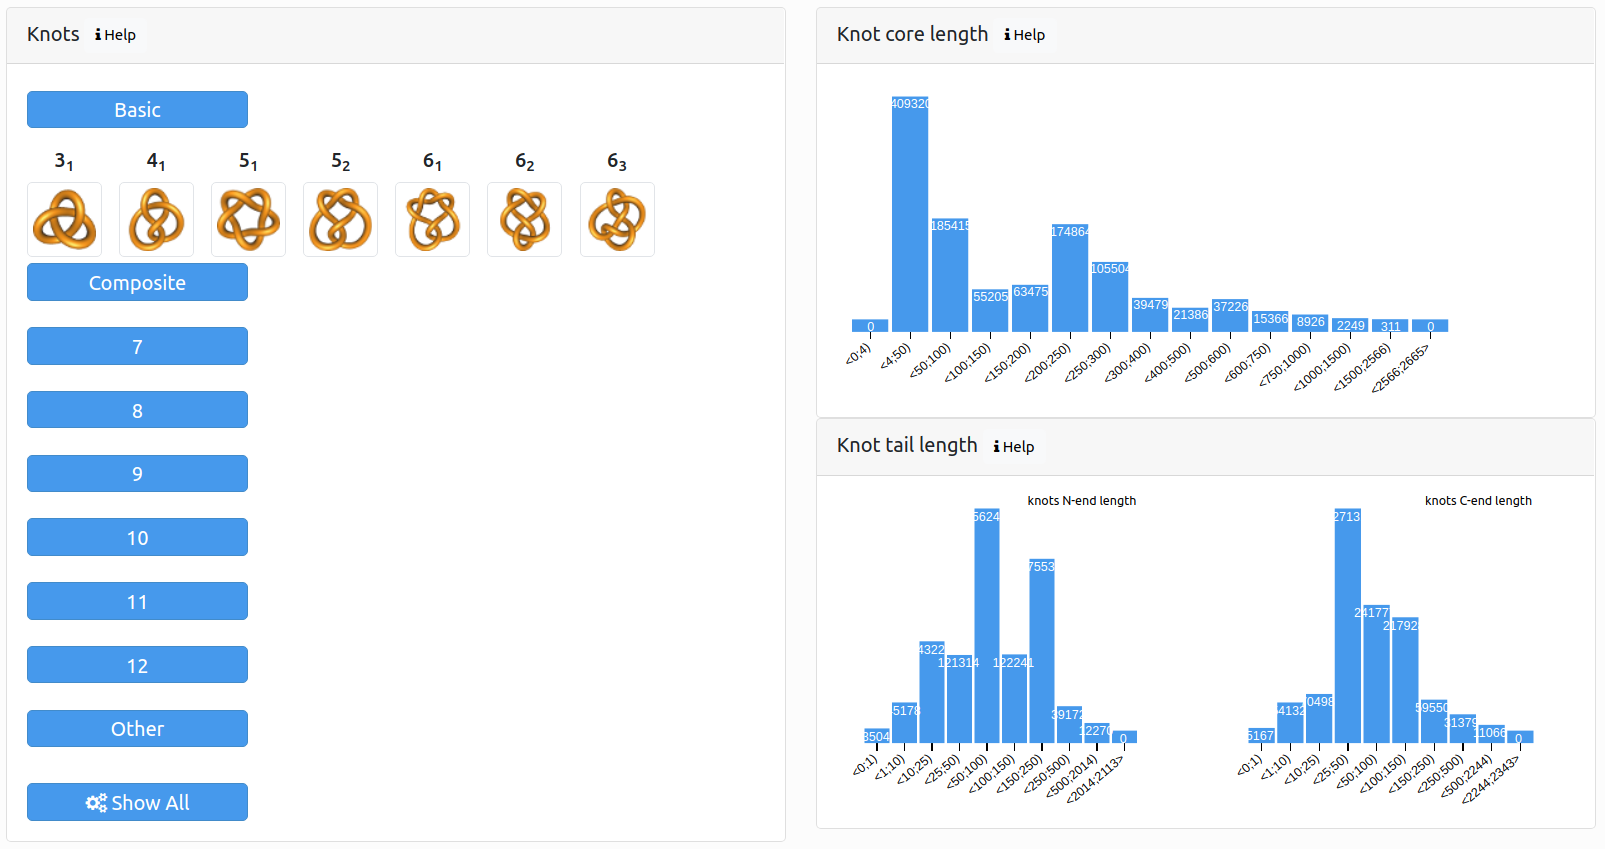
Figure 2. Search panel.
The Advanced search section provides more comprehensive tool for protein search. It lets you to create more complex queries by joining subqueries with logical operators, and control output format.
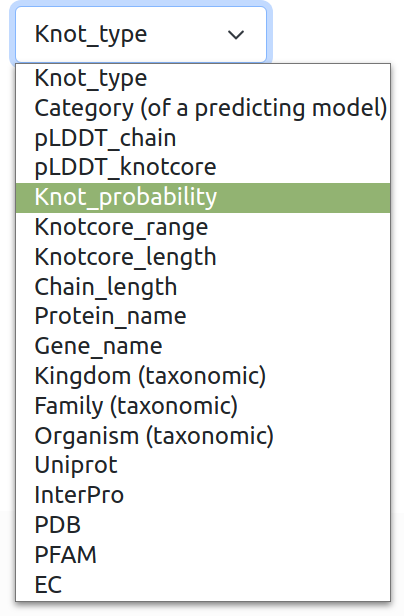
Possible subqueries can be composed of following categories:
Knot type: based on minimal number of crossings classification e.g. "3_1", "4_1", "5_1", "5_2". (For information how knots are classified check Knot Atlas: Rolfsen knot table).
Category of a predicting model: AlphaFold version 4 or 1, EMSFold version 1. Additionally results of AlphaFold version 1 are divided into credibility categories: knot, unsure, artifact, unassigned.
pLDDT chain: mean pLDDT value for a whole protein chain (What is pLDDT?)
pLDDT knotcore: mean pLDDT value for a knotcore part of protein chain (What is a knotcore?)
Knot probability: probability of the most popular knot after chain closure (How proteins are closed?).
Knotcore range: "index of knotcore beginning"-"index of knotcore end".
Knotcore length number of residues in knotcore part of protein chain.
Chain length: number of residues in protein chain.
Protein name based on UniProtKB record.
Gene name based on UniProtKB record.
Taxonomic: kingdom, family, organisms.
Bioinformatic codes: Uniprot, InterPro, PDB, PFAM, EC.
If you leave Show results button alone, your results will be shown in your browser in same format as when using "Browse database panel". Otherwise you can choose a number of different output options: display .csv in browser, download .csv file or download compressed (gzipped) .csv file. Furthermore, you can Customize result columns and add columns to the default output, or remove any columns. Finally press Search button.
The same possibilities are available using our multi-criteria API.
The Browse Database section provides a list of proteins which contain knots with at least 48% probability (see knot detection section). The list consists of proteins with their Uniprot accession code (Uniprot), source organism (Organism), protein name for the corresponding UniprotKb entry (Protein name), their knot topology (Knot type), pLDDT of a knotcore (pLDDT knotcore) and database from which structure prediction comes from (Category of predcting model). In the default screen, entries are sorted by the knotcore pLDDT.
Structures predicted by first version of AlphaKnot are divided into four subcategories based on our manual assignments: AF1 knot, AF1 unsure, AF1 artifact and AF1 unassigned. The AF1 knots category includes structures which are highly probable to be entangled. The AF1 unsure category includes structures where the knotted part of the protein is well predicted, but a general fold could have some unusual arrangements or there are other unsure elements of the prediction. In both cases for the unsure category, the structural prediction has enough ambiguity that one should view the knotting with some skepticism. The category AF1 artifacts contains proteins which we found to be unlikely due to an uncommon fold motif (such as containing many floppy segments which accidentally have become intertwined with each other).
Users can also browse a list of raw data, which consists of the full information on the protein and is available in the section Single protein data presentation as well.
After selecting a particular protein, the details for the query will be presented. Each protein page contains a few tabs:
Knotting data tabs for AlphaFold v4, AlphaFold v1 and ESMFold predictions (if available).
Protein information tab with corresponding gene, PFAM and InterPro codes, PDB structures and deposition dates.
Similar proteins tab with lists of proteins which have at least 40% sequence similarity to this protein.
Each Knotting data tab contains following fields:
Basic information about the structure (Fig. 4).
Knot map (only server or AF1): a matrix diagram (knotting fingerprint) of a protein (Fig. 4). The matrix changes depending on the selected knot probability cutoff. The fingerprint matrix can be expanded by selecting Zoom knot map option. Further details on how to interpret knotting fingerprints are described in the section How to interpret knotting data.
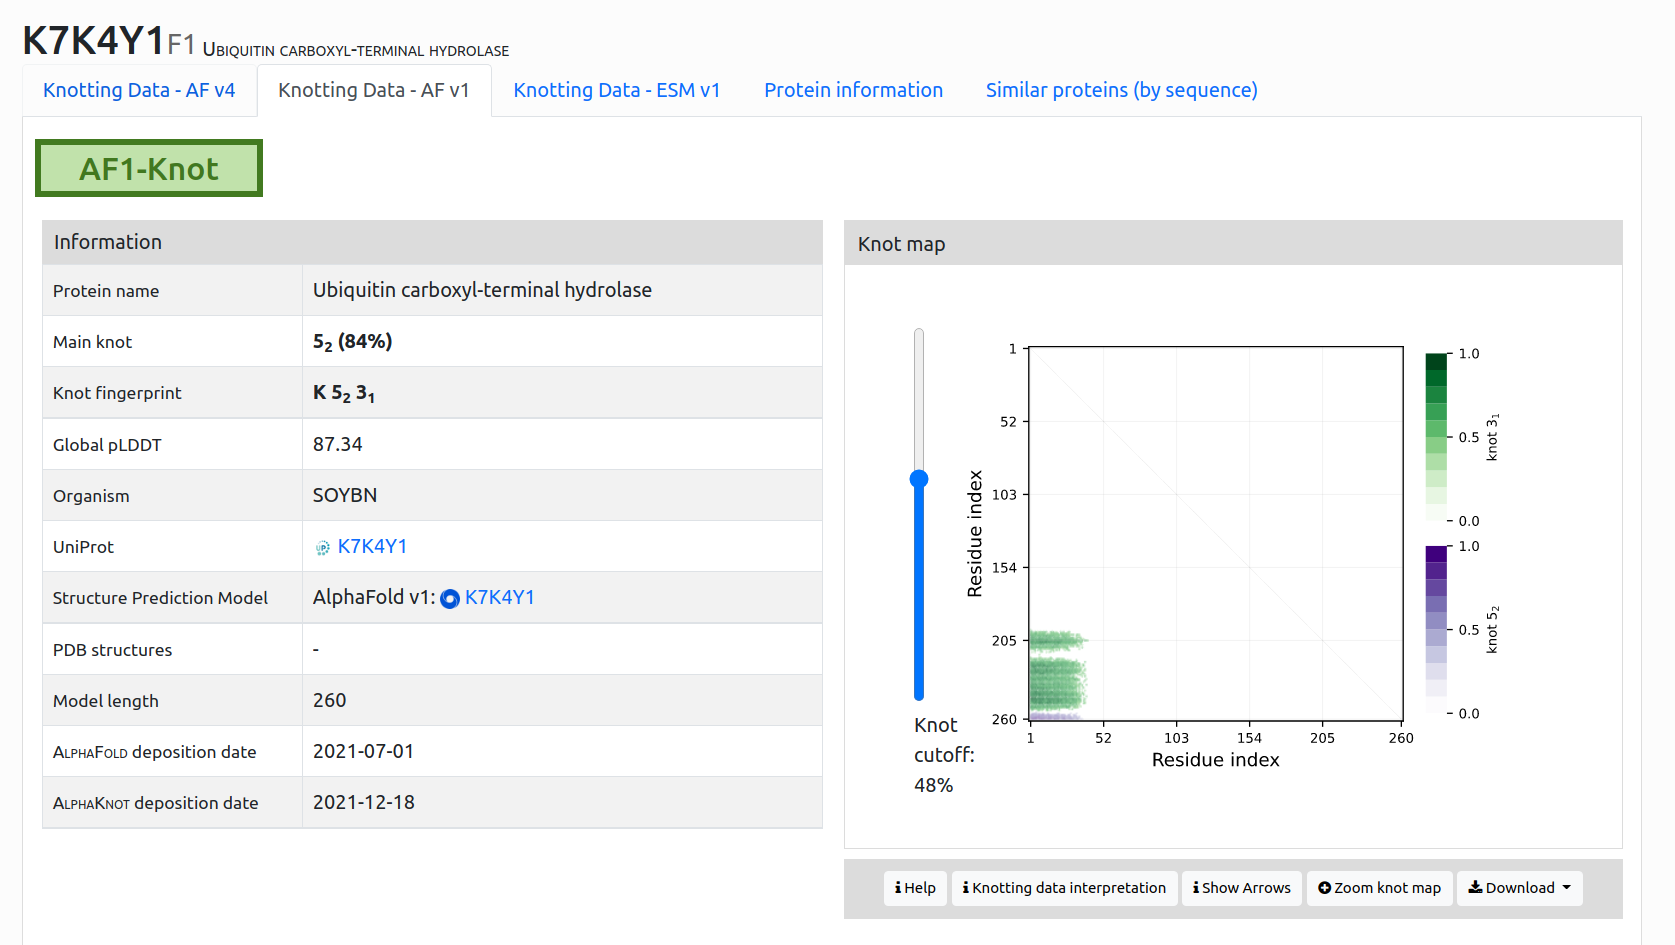
Figure 4. Single protein data presentation of protein K7K4Y1 in AlphaKnot 2.0. You can choose between up to three predicted structures for these protein based on: AlphaFold version 4, AlphaFold version 1, ESMFold version 1. The view provides general information as well as details about the topological type and a knot fingerprint for the selected protein.
Structure: a 3D graphic representation of the structure determined by AlphaFold and the amino acids sequence. Residues in the sequence are highlighted based on the 3D structure selection. By default the structure is colored by the AlphaFold scheme (pLDDT). It can be also colored by Rainbow or Default. Users can also define the amino acids range to be displayed (Fig. 5).
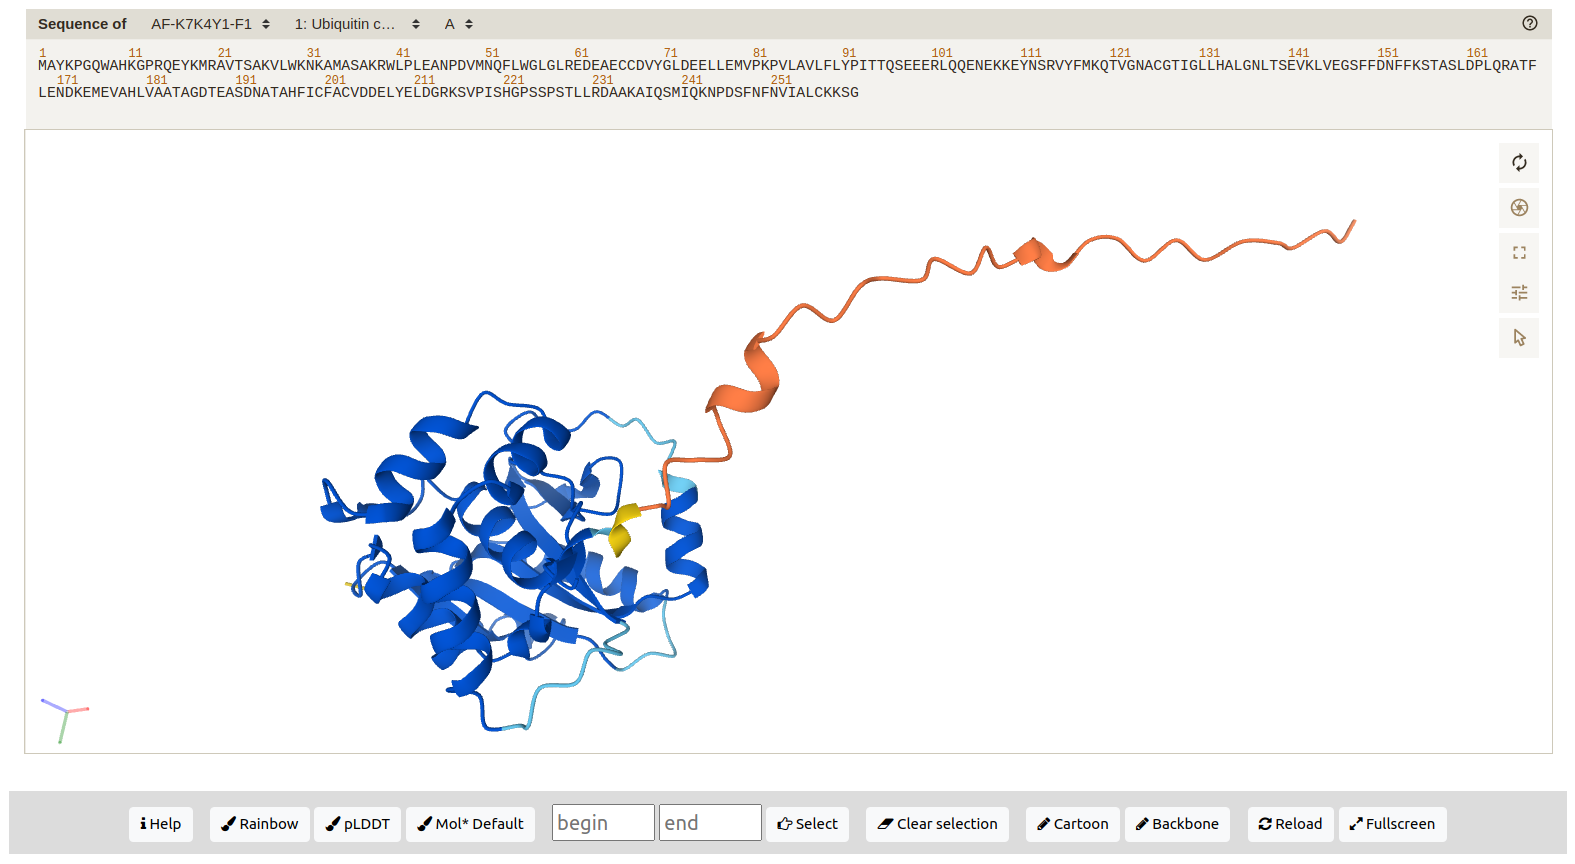
Figure 5. Amino acid residues 14-173 displayed in the 3D structure of protein K7K4Y1. The residues are colored by the pLDDT value.
Knot types & Model sequence: a list of knot types present in the protein. After selecting the View Details option, the knot core range is highlighted in the Model sequence underneath the table and in the 3D structure (Fig. 6).
A: 
B: 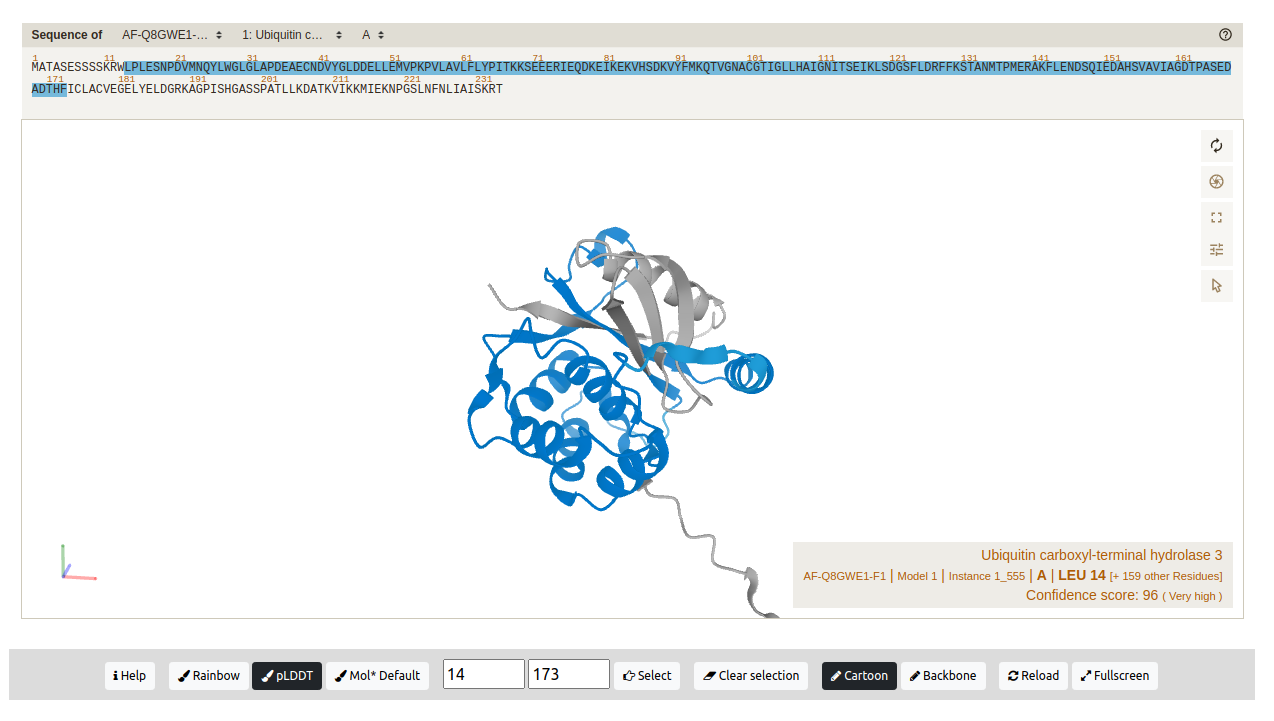
Figure 6. Knot types, model sequence, and structure panel. (A) A list of all the knot types present in protein K7K4Y1. The knot core residues of the knot 31 are highlighted in the model sequence through the View Details option. (B) After selecting the knot to be displayed, the amino acids are also colored in the 3D structure panel.
Furthermore, if a protein is longer than 1400 amino acids, AlphaFold generates multiple models with 1400 residues each. In this case, users can analyze each segment separately. After selecting a model from the list in the top-right corner, the fields with the knot map, protein structure, and knot table are changed according to the chosen model. Additional fields are included at the end of the page – a plot with comparisons of knotting between all of the models that build the protein structure (Knotting comparison of models, Fig. 7).
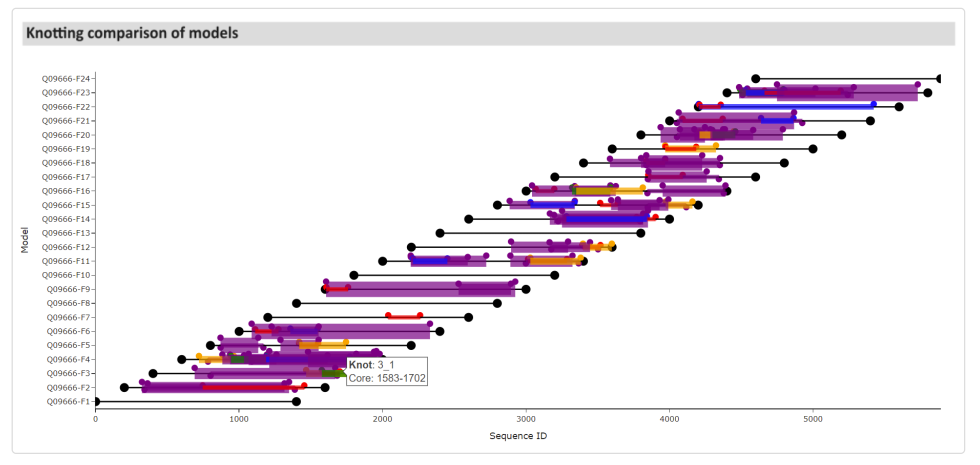
Figure 7. A plot showing the comparison of knot types present in models building the protein Q09666. The same knot type is marked with the same color. Hovering the mouse cursor over particular areas displays the knot type and its knot core range.