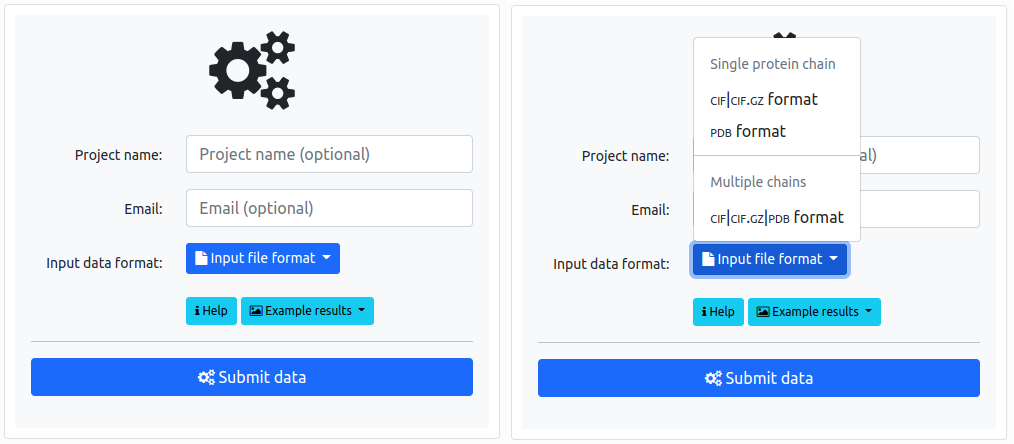
A user can upload and analyze two types of data: either a single structure, or a set of structures – possibly models of the same protein – whose topology one wants to compare. The "Input file format" button provides these two options. In this section we explain how to analyze a single structure.
The user can choose several options which determine what methods will be used to describe the entanglement in the structure, and also determine the accuracy of the calculations. The calculation time on the server is directly related to the selected parameters (and to the length and complexity of the structure). For a single structure, it varies from a few seconds to several hours. Therefore, choosing the correct options is important.
The key options to choose from are visible after expanding the "Calculate" list:
Knot core (default option, the fastest one) – means that the server will determine the knot type of the whole structure and, if it is knotted, the server will locate its knotted part. More precisely, the server will search for the shortest fragment of the chain which is (continuously) knotted with the same knot type as the whole structure.
Full matrix (the slowest option) means that the whole knot fingerprint map will be computed, i.e. the knot type of each subchain will be determined and the knot map will be drawn. By choosing this option, the user obtains the most detailed information about the topology of the chain.
Full matrix – only if the structure is knotted means that the server will first check to see if the whole structure is knotted. If it is knotted, the knot fingerprint map is computed. By choosing this option, the user can save a lot of time and not wait a few hours for a matrix which turns out to be empty (not containing knots), to be calculated. However, if the structure is slipknotted (i.e. the whole chain is unknotted, but contains subchains which are knotted), that information would be lost.
To detect a knot type, an open chain must be transformed into a closed chain (for more details see section Knot detection). A user can choose from three methods of closure:
Statistical method;
Direct closure (connecting two terminals by a direct line);
Out from the center of mass method (default option).
The first method is probabilistic and, additionally, the user can choose the number of random closures used to obtain the statistics. By default, this number is 20, which is not a large number. If the user analyzes a short structure, one may consider increasing this value (to a maximum of 100) to obtain more robust results. The last two methods are deterministic, and, thus, are much faster.
Additionally, the user can choose a level of accuracy: Quick, Medium, Detailed. To get faster results, we only perform accurate calculations for some parts of the chain. We strongly recommend the “Quick” option for longer structures.
Homologs can be searched in the Database on the selected by the user identity level, between 70%, 80%, or 90%.
Simplification of the structure via Knot Pull package can be also performed.
A structure uploaded and analyzed by a user is stored for 14 days (With the exception of structures uploaded via the recompute tool, which will update the corresponding record in the Database).
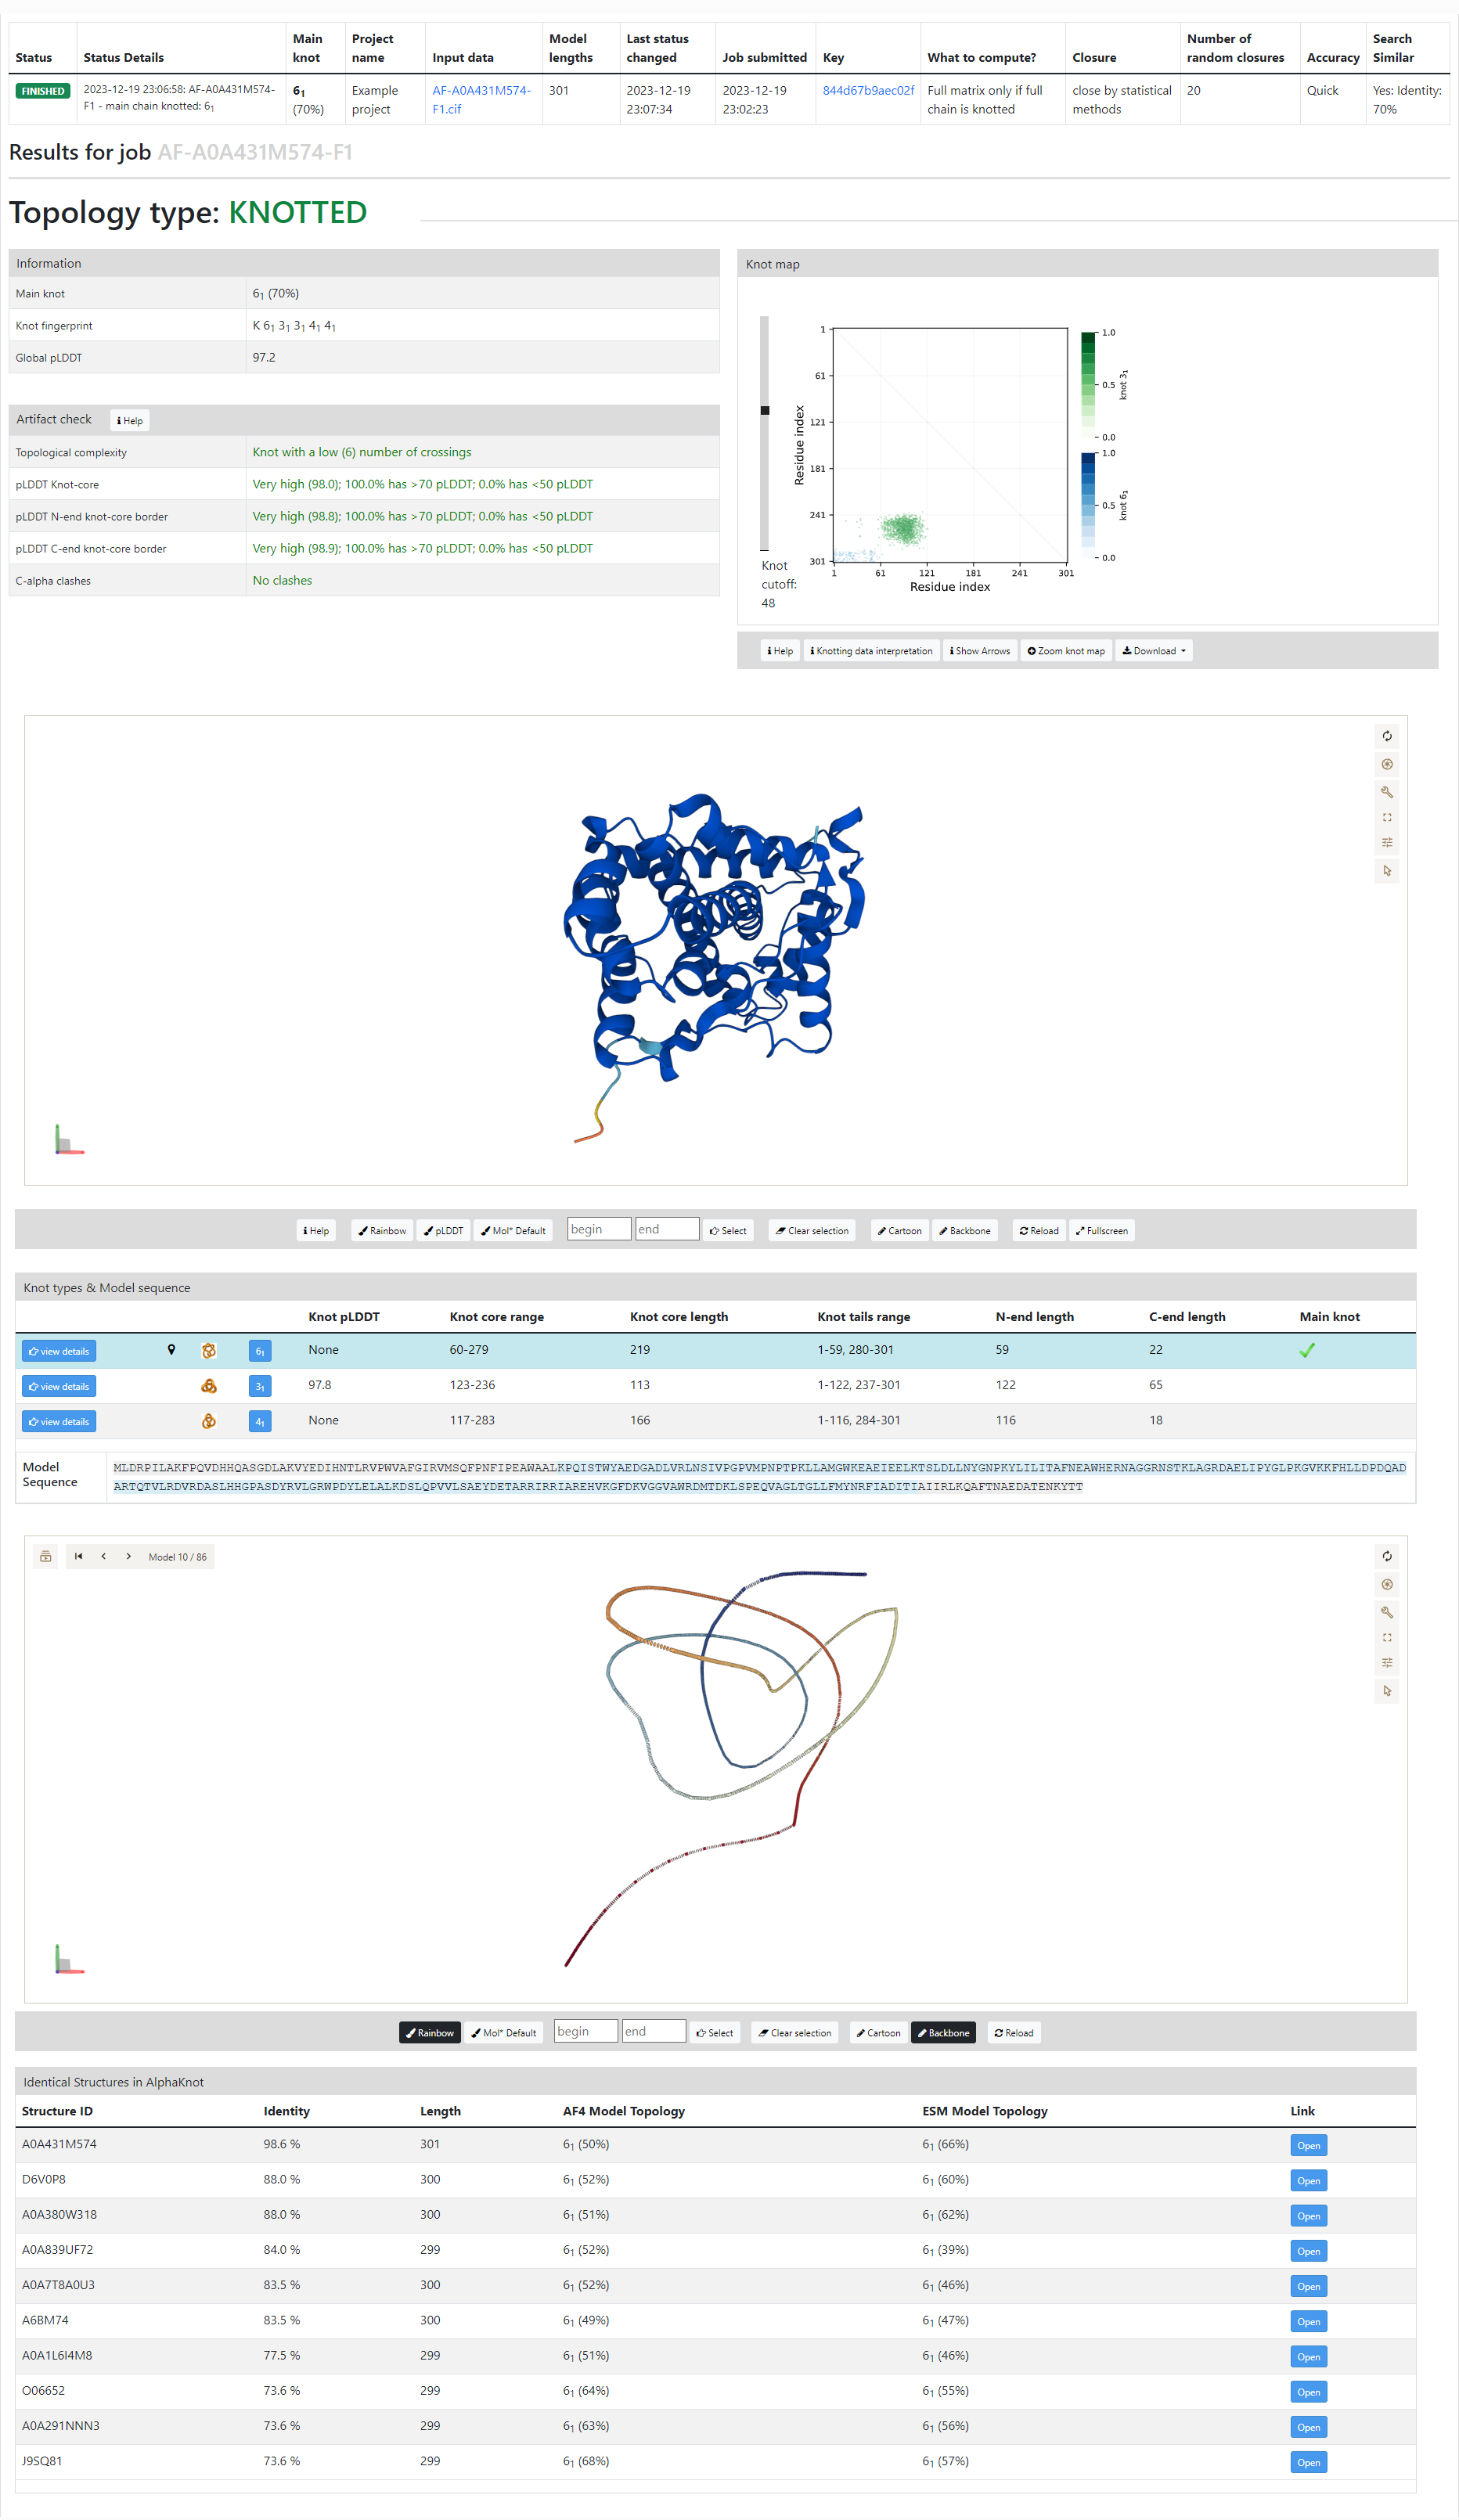
At the top of the output, there is a table that contains the status details of the job, information about main methods and parameters used for that job, and the main results. By refreshing the page, a user can track the progress of the work on the job.
When all the results are ready, there is information on whether the structure is knotted. If the structure is knotted or slipknotted, there is a view similar to the one for each record in the database. This view is divided into four main parts:
Information and Artifact check tables The information table consists of basic information on the topology of the structure (Main knot and Knot fingerprint) and about the quality of whole structure – the average pLDDT for whole structure (Global pLDDT). Artifact check table gives results of some automatic tests which can help the user to recognize if the knotted topology may be an artifact. The table may not be displayed if the input file does not contain the information about pLDDT. The value of pLDDT measures the confidence of the predicted position of particular amino acid.
All CIF or PDB files with structures predicted by AlphaFold do contain pLDDT values.
Topological complexity controls if the obtained knots have complexity that have not yet been observed yet in PDB-deposited proteins (measured by the number of crossings in minimal representation of a knot).
pLDDT Knot-core is the average pLDDT value of the knot core region (part of the chain where the knot is located); values below 50 are a strong indication that a knotted topology is an artifact; values below 70 suggest thet the result should be interpreted with extreme caution.
pLDDT N-end/C-end knot-core border are the average pLDDT values of 10 residues around the knot core borders, which are crucial parts of the chain to the formed knot.
C-alpha clashes controls if there are parts of chain which are located at a distance shorter than 1.5A from each other.
If there is any information in red in this table, the user should be leery about the results.
Knot map – the map is not visible if the Knot core option was chosen.
View of the structure
Knot types and model sequence
[New!] Simplification of the structure (via Knot pull package)
[New!] List of similar proteins in the database with their topology
If the structure is unknotted then the knot map and the structure are displayed only if the knot fingerprint matrix was computed and some subchains are knotted with the probability higher than 30%
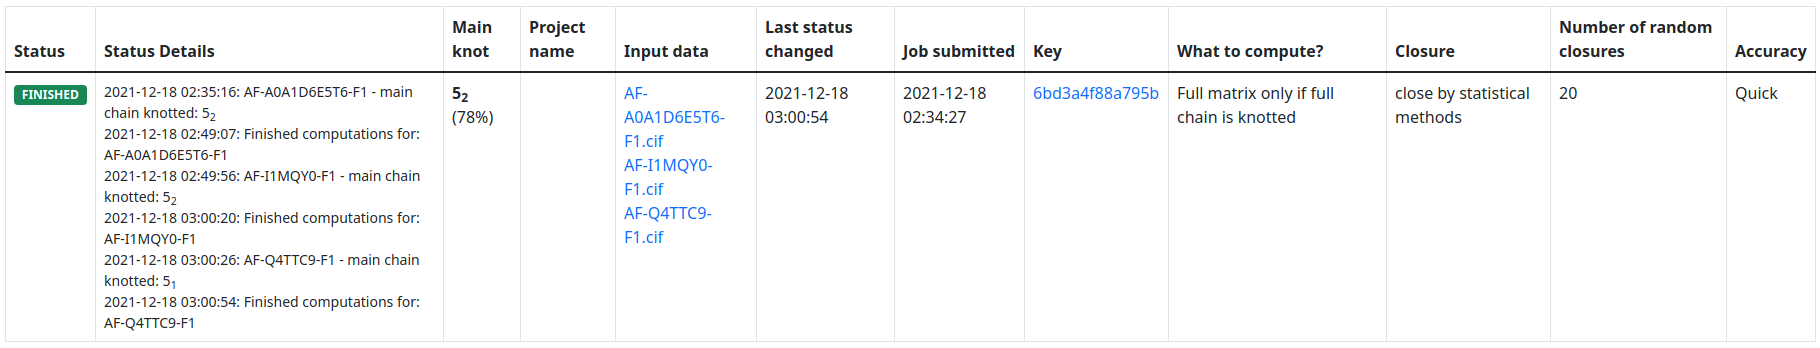
Up to 10 files in CIF or PDB format can be uploaded at once. These can be different models of the same structure (as in this example) or any other set of structures. In this case, at the top of the output page, we can select the model / structure for which we want to see the results.
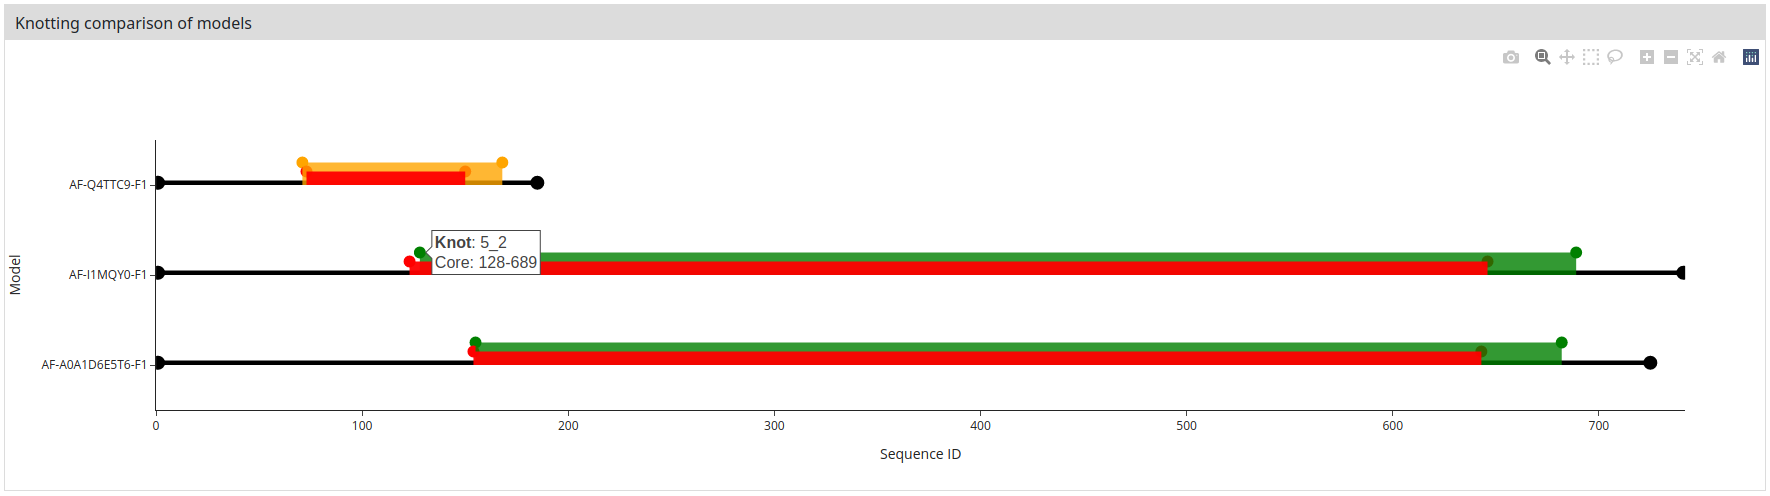
And at the bottom of the view, we additionally see a comparison of the location and types of knots in each structure. The color of the bar corresponds to the type of knot. When the user hovers the mouse over the dots ending the colored bars, information about the knots is shown.
As a new addition to AlphaKnot 2.0 user can now use recompute tool to redirect structures currently available in the database to the server to obtain additional information. User can control the parameters of the calculation similar to the direct structure upload described above.