The knot map shows knotting in all possible subchains of a structure. The set of subchains with the same knot type are represented by the same color, with the opacity of the color representing the probability of obtaining the given knot type over the set of closures. The bottom-left corner of a knot map shows the knot type for a full chain. The bottom axis shows index of the first amino acid of the subchain, while the left axis shows index of the last amino acid of the subchain. Therefore, points to the right of the bottom-left corner show the knotting of subchains as residues are removed from the N-end. Similarly, going up from the corner one can see the knotting of subchains as residues are removed from the C-end.
When a knot emerges after cutting off part of the chain, we call it a slipknot. The knot matrix shows both knots and slipknots:
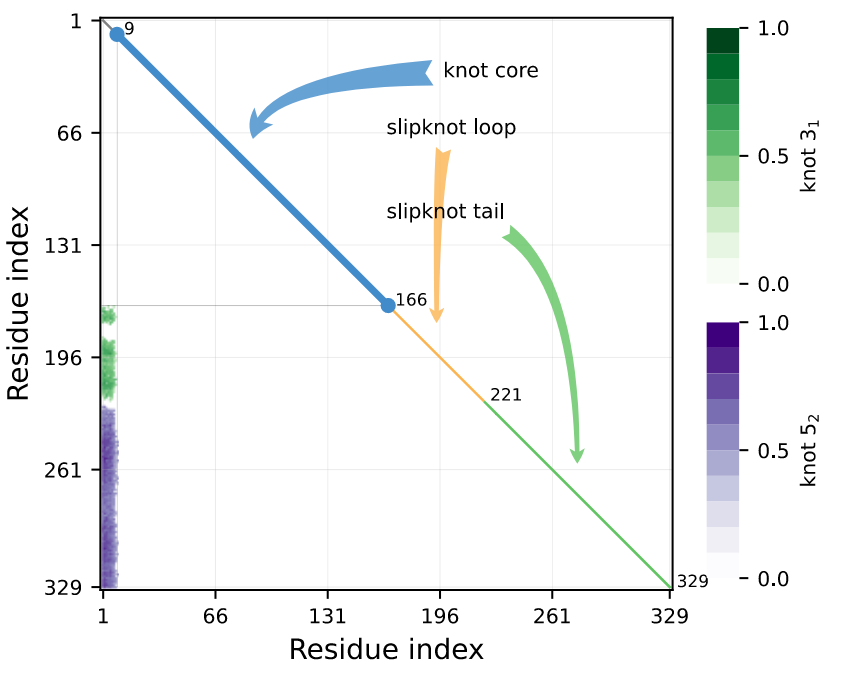
Figure 1. Example of a knotting fingerprint with K523131 topological notation. View protein Q9WUP7 in AlphaKnot 2.0.
Knot types of all possible subchains af a structure can be summarized in the form of a knot fingerprint. This might be important for fast comparison of topologies of different proteins, e.g. within one family. Knot types found in a knot map are written out and ordered by the size of the knot core. Shorter knot cores follow the longer ones. If knot cores have the same size, then the knot core with lower N-end index is written first. If the longest entangled structure is a slipknot, the fingerprint starts with ”S” (slipknot), otherwise it starts with ”K” (knot).
To date, the knot fingerprints found in proteins deposited in PDB are: K31, K4131, K4141, K523131, K61614131. However, among artifacts found in structures predicted by AlphaFold, significantly more complex knot fingerprints have been found. If there are more than 4 spots with the same knot type in the knot map, then the knot fingerprint is shortened – e.g. K61(x3)4131(x10).
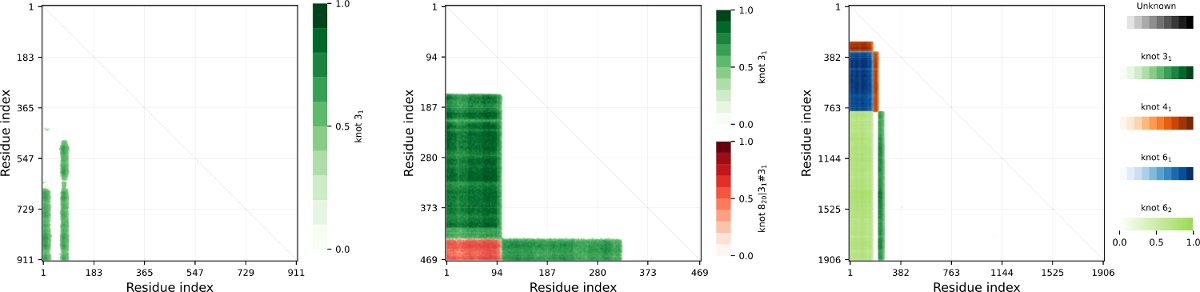
Figure 2. Examples of knots maps. Left: Protein Q9QWF0, fingerprint K31313131. Center: Protein Q4DMW6, fingerptint K31#313131 . Right: Protein P54683 (artifact), fingerprint K6261414131.
One of the ways to quickly check for the knot conservation is to verify the topology of homologs - proteins with high sequence identity level to the target.
In the AlphaKnot 2.0 this is now possible via server using recompute option (See How to use server for more information). After finishing the job, proteins with the specified identity level (70-90%) will be shown in a form of a comprehensive table, on the "Indentical proteins (by sequence)" tab. See the Figure below.
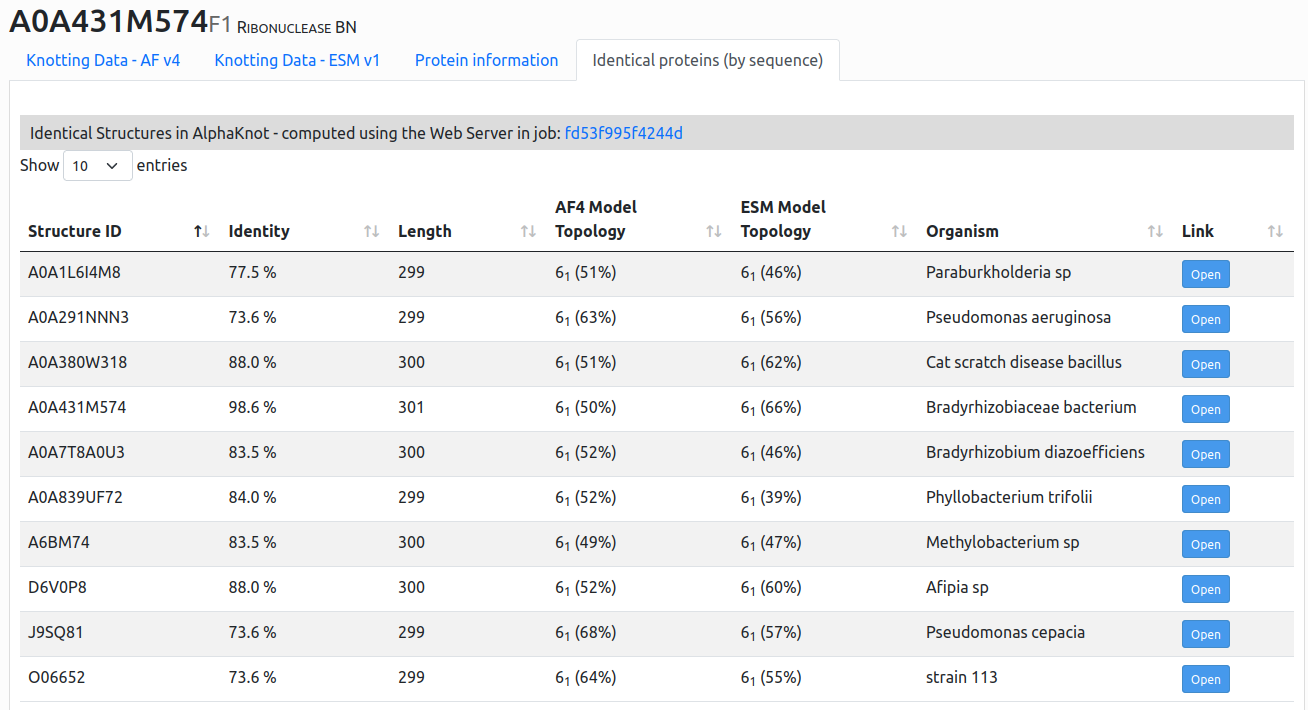
Figure 3. Example of the output of proteins with at least 70% identity level to the A0A431M574 target with 61 topology. We can observe that all found records also share the topology, increasing the confidence of the results.